
You open Google Keyword Planner, type in a term, and the volume column reads "1K–10K" instead of a single number. That is not a bug and not a penalty on your account — it is how Google reports volume to accounts that are not running ads with spend. Understanding why the range appears, and what you can and cannot do about it, stops you from either chasing an impossible "exact number" or abandoning a perfectly usable estimate.
Why Keyword Planner shows a range instead of a number
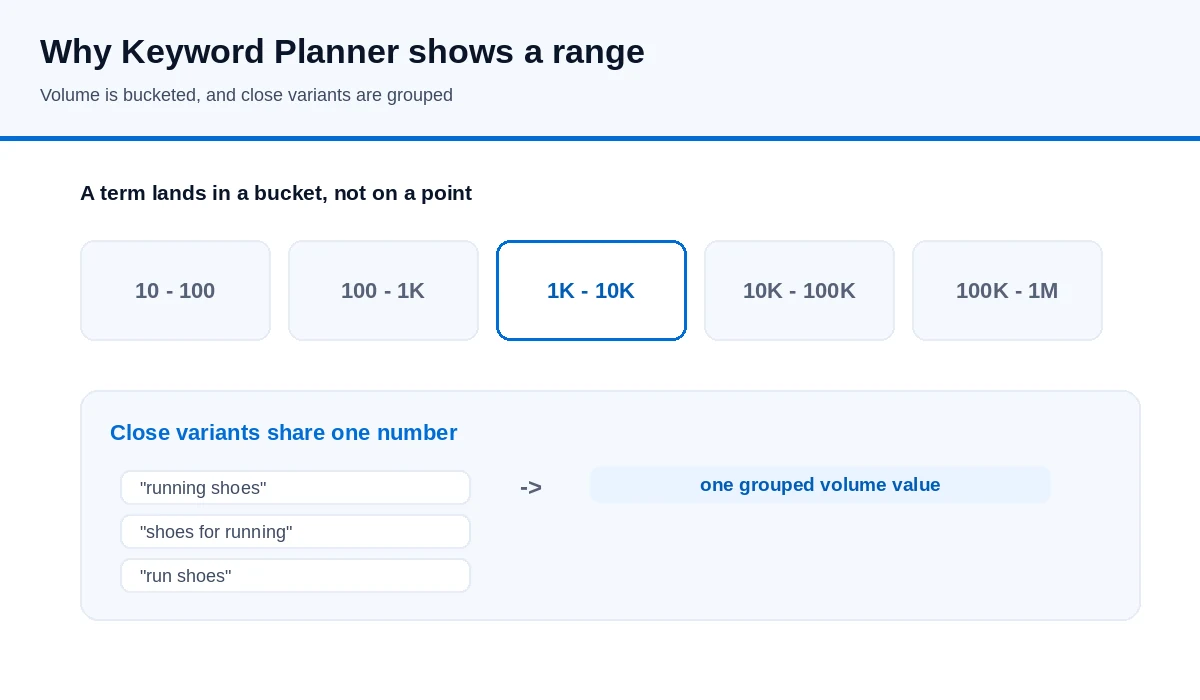
Google surfaces two related facts in its own help material. First, to use the basic features of Keyword Planner at all, including "Get ideas for new keywords", you must complete your account setup, including entering billing information (Google Ads Help). Second, the volume figure itself is defined as the average number of times people searched for a keyword and its close variants for the month range, location and network you selected. When a figure is bucketed into a range like 100–1K or 1K–10K, it is telling you roughly where the term sits in Google's data, aggregated for privacy and stability, rather than claiming a precise count.
In other words, the range is a property of how the estimate is published, not a limitation unique to your login. Even accounts that see more granular data are reading an estimate drawn from the same kind of advertising data.
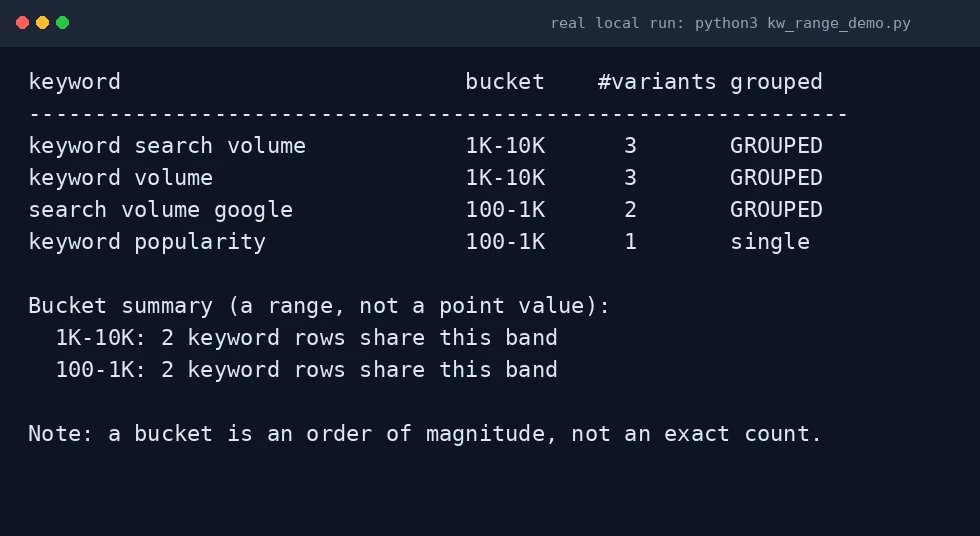
#!/usr/bin/env python3
# Illustrative fixture: why Keyword Planner reports a RANGE and why close
# variants share one value. Data here is a hand-made example, NOT Google data.
rows = [
    {"keyword": "keyword search volume", "bucket": "1K-10K", "variants": 3},
    {"keyword": "keyword volume",        "bucket": "1K-10K", "variants": 3},
    {"keyword": "search volume google",  "bucket": "100-1K", "variants": 2},
    {"keyword": "keyword popularity",    "bucket": "100-1K", "variants": 1},
]
print("keyword                          bucket    #variants grouped")
print("-"*62)
for r in rows:
    flag = "GROUPED" if r["variants"] > 1 else "single"
    print(f'{r["keyword"]:<32} {r["bucket"]:<9} {r["variants"]:>3}       {flag}')
What the range is still good for
| Use the range for | Do not use the range for |
|---|---|
| Ranking terms by order of magnitude (tens vs thousands vs tens of thousands) | Reporting a single "monthly searches" number as if it were exact |
| Comparing two similar terms to see which is larger | Deciding between two terms that sit in the same bucket |
| Spotting terms that are too small to be worth a dedicated page | Forecasting traffic to a precise figure |
| Sanity-checking a third-party tool's estimate | Settling a disagreement between two tools by claiming Google is "the truth" |
The most important habit is to compare within a bucket cautiously. If two terms both show "1K–10K", the range does not tell you which is bigger — you need the trend and the live results to break the tie.
Why different languages and countries move the number
Volume is tied to the location and search network you selected when you ran the query. Leave the location on "all locations" and you are comparing a global figure; set it to a single country and the same term can drop a bucket or more. The same is true of language. Before you compare two rows in your table, check that both were measured with the same country, language and network settings — otherwise you are not comparing the same market.
What to do if you need more than a range
- Confirm your settings are consistent. Re-run the list with one country, one language and the same network so every row describes the same market.
- Read the close variants. If several phrasings share one volume line, that is Google telling you they were grouped. Do not treat them as separate demand.
- Triangulate with a second source. Use Google Trends for direction, your own Search Console data for real queries you already receive, and one paid tool used consistently for estimated volume and difficulty.
- Use the official API if you are building a pipeline. The Google Ads API's Generate historical metrics returns average monthly searches, per-month volumes, competition level, a competition index and bid percentiles for a keyword list — the documented programmatic equivalent of Keyword Planner.
- Accept the band and decide. If the low end of the range still represents valuable, convertible searches, the exact number does not change the decision.
Common questions
Why does Keyword Planner show no data at all for some keywords?
Google notes that very low-volume keywords, and keywords in sensitive categories such as health or finance, may not be discoverable or forecastable at all. That is a coverage limit, not proof of zero demand.
Do I have to run ads to use Keyword Planner?
You need to complete account setup, including billing information, to access the basic features. You do not have to keep an active, spending campaign to keep using the tool, but the granularity and some features behave differently depending on the account.
Why does the same keyword show different numbers on different days?
Forecasts are refreshed daily and are based on roughly the last 7–10 days of data, adjusted for seasonality, so movement between refreshes is expected. Very small movements are noise, not a trend.
Related reading
- What tools show Google keyword search volume, trends and competition
- How to cross-check keyword search volume when tools disagree
- How to compare keyword search volume across countries
Sources
- Google Ads Help — Use Keyword Planner
- Google Ads Help — About Keyword Planner forecasts
- Google Ads API — Generate historical metrics
The bucket labels and interface wording above reflect Google's documentation at the time of writing; check the current help article for any change. This page does not report invented volumes.