
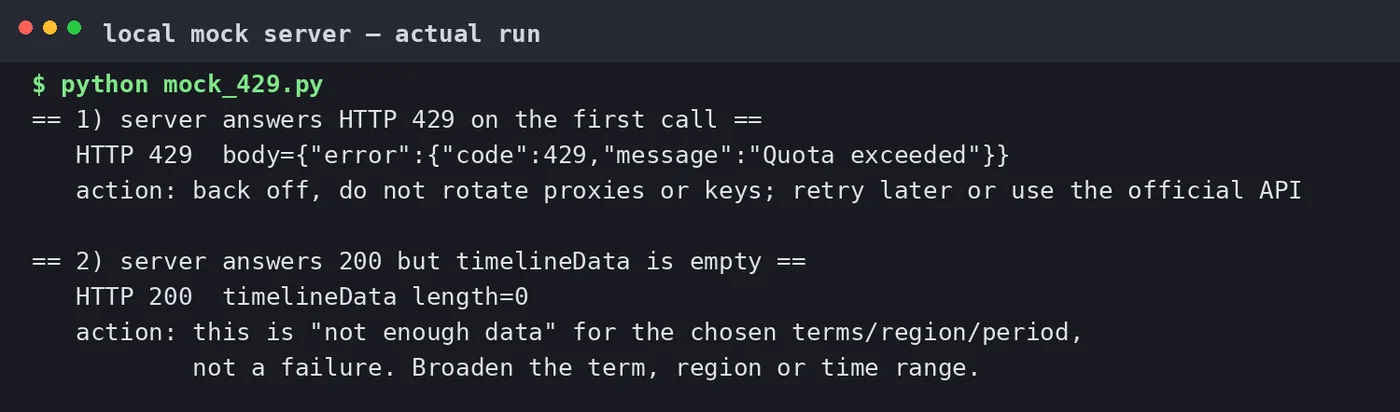
When a Trends request fails, people tend to see three different things and treat them as one: an HTTP 429, an empty or null response, and the message "not enough data". They have different causes, and two of the three are a signal that you are using the wrong interface in the first place. This article separates them and shows what to do that does not involve fighting Google's rate limits.
First, identify which failure you actually have
| What you see | Most likely cause | Correct response |
|---|---|---|
| HTTP 429 (Too Many Requests) | You are sending too many requests to an endpoint that is not meant for bulk use | Stop hammering it; use the official API or the website export, and cache |
| Empty body / HTML instead of JSON | A token or session the request depended on has expired, or the endpoint changed | Refresh properly or, better, move to a supported data source |
| "Not enough data" / no points plotted | The term genuinely has too little volume in that geography and time range | Widen the geo or time range, or accept that demand is too small |
If you are hitting the private trends.google.com/trends/api/widgetdata/… endpoints, the 429 and the empty body are the expected behaviour of an unsupported interface, not a bug you can code around. The rest of this article is about fixing the request properly, not about avoiding the limit.
Why the private endpoints fail
The Trends website itself calls internal endpoints to draw its charts. Those calls carry a token the page generates when it loads, and they are intended for a single interactive session. Scripts that replay them quickly — especially from a datacenter or VPN IP — get throttled, and after a change to the site the same script returns an empty body. Nothing here is documented, so there is no "correct" retry strategy to write.
Rotating proxies, cycling tokens or spreading requests across IPs to get around the throttle is exactly the kind of traffic the limit exists to stop. It is fragile, it breaks constantly, and it is not something to build on. If you need Trends data programmatically and reliably, the supported path is the official API.
The supported fixes, in order
1. Use the official Google Trends API (alpha)
Google announced an official Trends API in alpha in July 2025. Access is granted on request, and once you have it you are calling a documented interface with a real quota rather than scraping an internal route. This is the only route that is safe to build a product on. See Google Trends API and data export for how the three routes compare and how to apply.
2. Cache what you fetch
Trends data barely moves within a day. A weekly interest series does not need to be re-fetched on every page load. Store the last successful result and reuse it; this removes most of the traffic that triggers throttling, whichever interface you use.
3. Export from the website for one-off needs
For a report or a teaching example, the website's "Download" menu produces a CSV in a few seconds. It is manual, but it never returns 429 and the numbers are the same ones the chart shows.
4. Fix "not enough data" by changing the question
An empty chart is often correct feedback, not an error. Try, in this order:
- Widen the geography. A term with a handful of searches in a small country may have enough data worldwide.
- Widen the time range. A 7-day window is noisy; 12 months or 5 years gives the system more to work with.
- Check the spelling and language. A misspelled or mis-localised term can produce no data even though the idea has demand.
- Compare the term with a larger one. If a term is very small, compare it against a bigger, related term to see the relative shape.
Common configuration mistakes
- Mixing scales. Comparing terms you exported in separate sessions puts them on different 0–100 scales. The comparison is then meaningless.
- Reading 100 as a volume. Trends normalises to the peak in the selected window. It is not a count of searches.
- Ignoring the geo parameter. A worldwide value and a single-country value are not interchangeable, and a US value will not match a German one.
- Treating "rising" as commercial. A fast-rising related query can be a news spike with no buying intent. Validate it with a volume tool before you write for it.
When to abandon a request and change tools
If a term returns no data after widening the geo and the time range, the demand is simply too small to justify a page. Put the effort somewhere with evidence instead. Conversely, if you need volume, competition and difficulty — not relative interest — Trends is the wrong instrument, and a volume source is the right one. The companion article on tools for keyword volume and competition maps each question to the data that can actually answer it.
Guangsuan (光算) helps businesses turn keyword and trend research into pages that rank, as part of its Google SEO service. If your problem is a pipeline that keeps breaking, start by replacing the unsupported interface with the official one; that single change usually ends the 429s.
Sources
- Google Search Central — Introducing the Google Trends API (alpha)
- Google Trends Help — Compare trends
- Google Search Central — Robots.txt and polite crawling
Published quotas and the availability of the alpha API are controlled by Google and can change; verify against the official documentation rather than third-party scripts.