
People search for a "Google Trends API" because they want Trends data in a spreadsheet, a dashboard or a script instead of clicking through the website. There are three ways to get that data, and only one of them is a supported API. Knowing which is which prevents a lot of wasted work — and stops you from building a product on an interface that is not a public API at all.
The three routes, and what each one really is
| Route | What it is | Good for | Limits to expect |
|---|---|---|---|
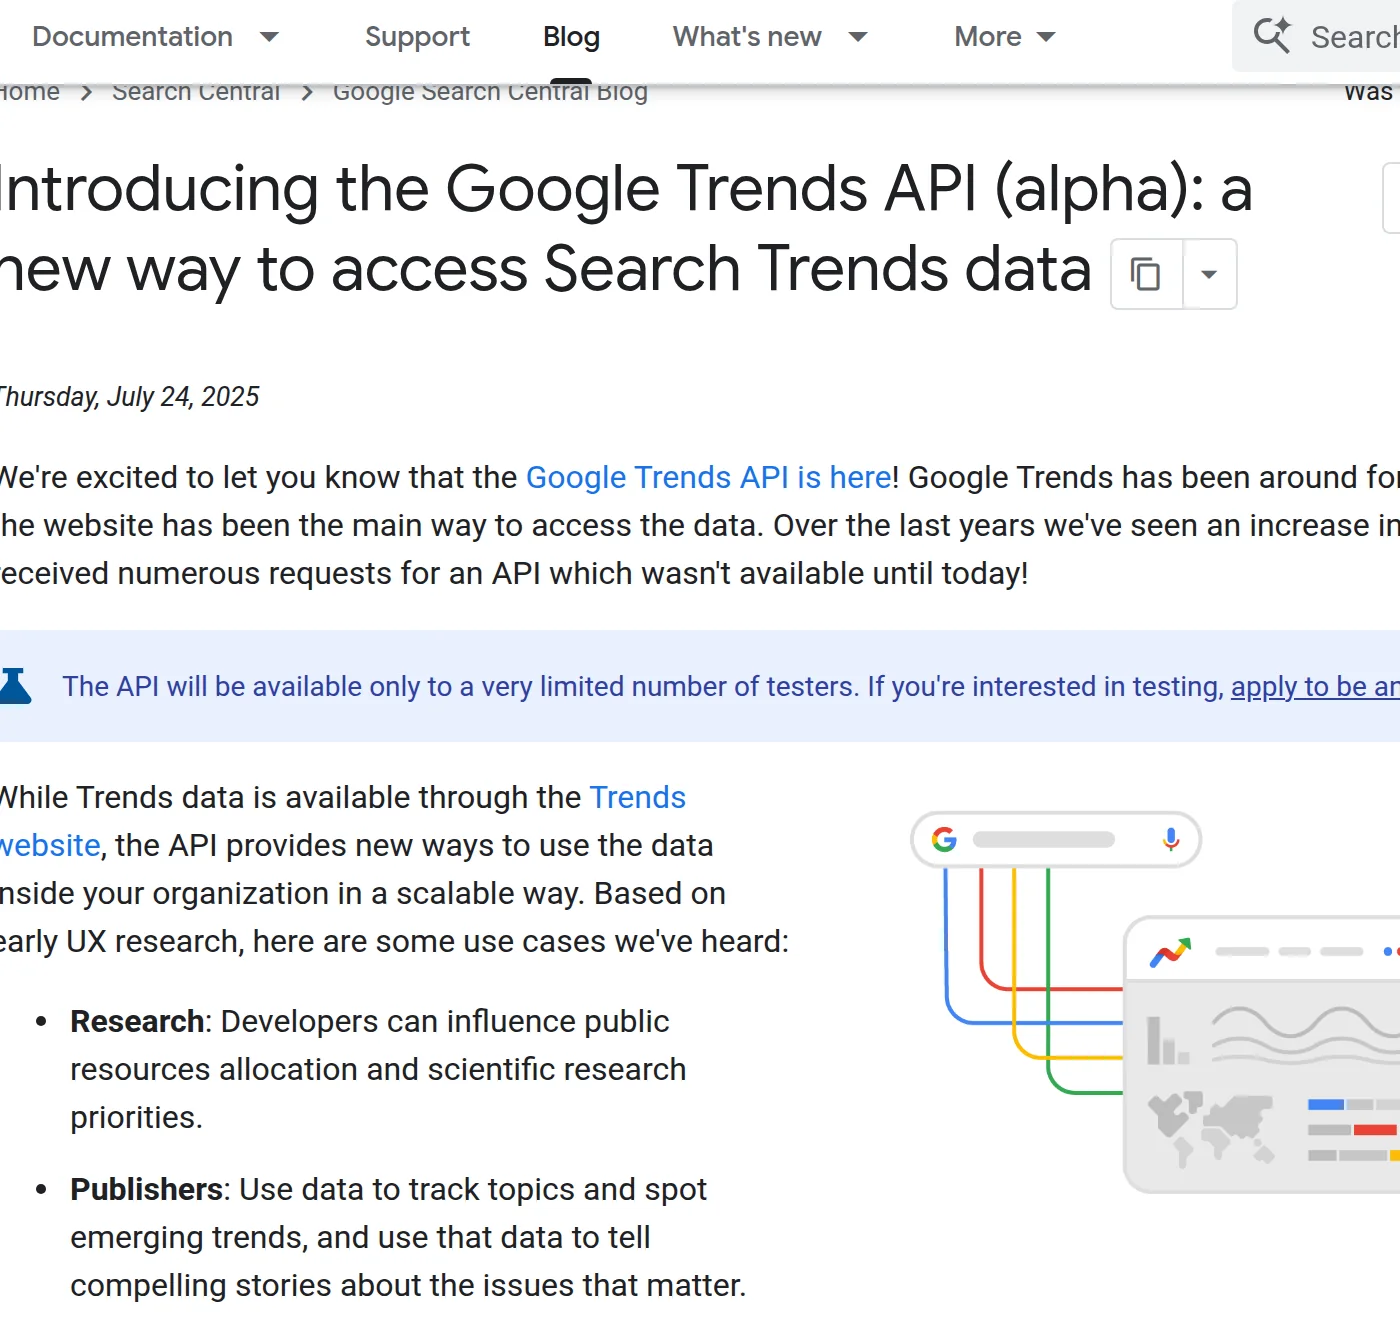
| Google Trends API (alpha) | An official, access-controlled API announced by Google in July 2025 | Automated, repeatable access to Trends data at scale | Alpha access is requested and granted by Google; it is not an open endpoint with a public key |
| CSV export from the Trends website | The "Download" menu on the Trends charts | One-off analysis, reporting, teaching | Manual, one chart at a time, and the values stay relative (0–100) |
Legacy widgetdata / internal endpoints | Private requests the Trends website itself makes | Occasional reading when nothing else works | Undocumented, token-based, changes without notice, and rate-limited |
If your goal is a reliable, repeatable pipeline, the honest answer is: apply for the official API. If you need a number once, export a CSV. The third route is not a foundation for anything you depend on.
1. The official Google Trends API (alpha)
Google announced the Trends API in alpha in July 2025 on the Search Central blog. Unlike the older Search Console API, this is not something you can enable with a free API key from a docs page. Access is gated: you request it, and Google grants it to a limited set of users while the API is in alpha.
What it is designed to give you is the same kind of data the website shows — interest over time, and the related-query data — but through a documented interface you can automate, instead of scraping the site. Because it is alpha, expect the terms, quotas and stability to change; do not promise a client a fixed SLA that Google has not published.
How to get access
- Read the announcement post and the current Trends API documentation on the Google Search Central / Trends developer pages.
- Use the request/interest form linked from that documentation to apply, describing your use case.
- If approved, follow the documentation's authentication and endpoint guidance. Do not assume the endpoint shape from blog posts written before the API existed.
- Build with caching and retries from day one. Trends data does not change minute to minute, so caching is easy and saves quota.
I could not find, in the public documentation, a published request-per-day quota for the alpha. Treat any specific number you see quoted online as unverified unless it comes from Google's own docs for your approved account.
2. Exporting data from the website to CSV
The website path is the fastest for a single question and needs no approval.
- Open Google Trends and set the term, geography and time range.
- Use the "Download" menu above the chart. "Interest over time" gives you a CSV with a date column and a 0–100 value column. Related-queries data has its own download.
- If you compare several terms, export them together so they share one scale. Exporting them separately and joining the files produces numbers that are not comparable.
Reading the CSV correctly
import pandas as pd

df = pd.read_csv("trends_export.csv", skiprows=1)   # the first row is a title
df.columns = ["week", "interest"]
df["week"] = pd.to_datetime(df["week"])

# The peak week is 100 by definition, not the busiest week ever.
peak = df.loc[df["interest"].idxmax(), "week"]
print("Peak in this window:", peak)
print("Mean interest:", round(df["interest"].mean(), 1))
The most common mistake is treating 100 as "the maximum volume". In Trends, 100 means "the highest point within the window you selected". Change the window and the same week can show a different value. This is why Trends answers "when and whether interest is rising", while a volume tool answers "how big".
3. Why the old widgetdata endpoints are a trap
Before the API existed, tutorials showed how to call the internal endpoints the Trends site uses, for example a /trends/api/widgetdata/multiline request. These calls need a token that the page generates at load time, and they are rate-limited — which is why so many scripts suddenly return 429 or an empty body. They are not a supported product. Google can change the response shape, the token handling or the availability at any time, and it has no obligation to keep them working.
That means: use them, if at all, only for occasional, low-volume reading. Do not ship a client dashboard, a paid tool or an automated report that depends on them. The moment Google changes something, you own the outage.
A practical workflow
- Direction first. Use Trends (API or website) to see whether interest in a topic is stable, seasonal or declining, and to compare a few candidate terms.
- Size second. Take the terms that look promising into a volume source — Google Keyword Planner, or a paid keyword tool — to estimate demand.
- Competition third. Judge how hard the term is to rank for using the actual top results, not only a vendor's difficulty score.
- Record the window. When you save Trends numbers, note the geography and date range. Without them, the numbers cannot be compared later.
Where this fits in the bigger picture
Trends data is an input, not a content plan. Once you know demand exists, the work that produces traffic is turning the terms into pages with a clear intent, one topic per page, and internal links that connect them. If you would rather have that whole chain handled — research, content, technical work and links — see Guangsuan's Google SEO service. For a broader comparison of the tools that produce volume, trend, competition and difficulty data, see what tools show Google keyword search volume and trends, and for the analysis side read how to interpret Google Trends data.
Sources
- Google Search Central — Introducing the Google Trends API (alpha)
- Google Trends
- Google Trends Help — Compare trends
The exact availability and terms of the Trends API alpha are set by Google and can change. Check the official documentation for your account before relying on it in production.