
The earlier version of this page carried a list of 2025 mobile-versus-desktop percentages — click-through rates, conversion rates, "voice search share" and country growth figures — that could not be traced back to a source you or I could open. Those numbers have been removed. What follows keeps two things strictly separate: a global, checkable statistic, and your own Search Console device report. Confusing the two is the most common mistake in this topic.
The global picture (and what it is not)
The most cited public source for device share is StatCounter's global stats. For September 2026 worldwide, its Desktop vs Mobile Market Share report shows Mobile 60.04% and Desktop 39.96%. That is a real, dated, checkable figure — and it is a share of web traffic by device, not a statement about your industry, your country, or your buyer.
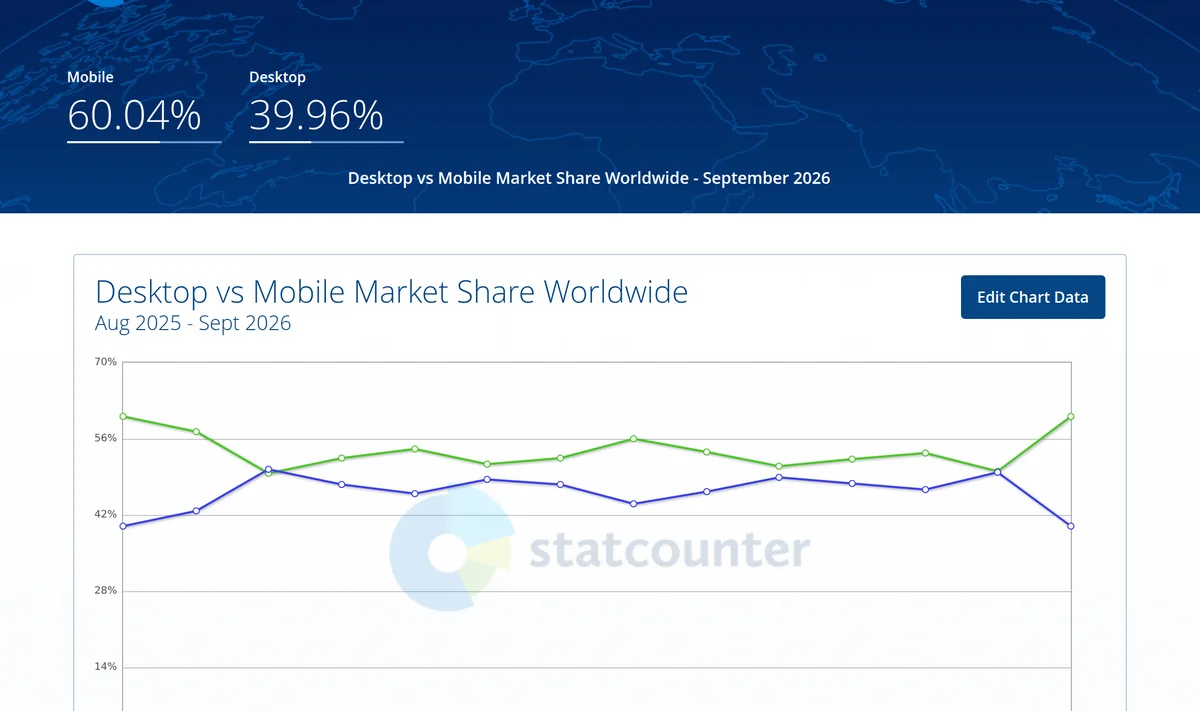
Two limits matter before you act on it. First, the split varies widely by country, so a worldwide average can be wrong for your market. Second, it measures general web traffic, while search behaviour and conversion differ by industry — B2B and technical audiences skew desktop in many cases.
Your site is not the global average
The only figure that should drive your work is your own Search Console device report. As a concrete example, here is the device breakdown for this site over the 28 days ending 2026-10-01, aggregated by impressions:

A technical/B2B site can look like the mirror image of the global average: desktop dominates impressions while mobile is a minority. If you read only "mobile is 60% worldwide" and rebuild your strategy around it, you optimise for a device your visitors mostly are not using — and ignore the platform where some of your clicks actually happen.
What to do with the number once you have it
- Segment before concluding. Apply the device filter and look at your top queries and landing pages separately for desktop and mobile. A device split that is 80/20 overall can be 50/50 for one product line.
- Compare average position by device. It is normal for the same page to rank differently on mobile and desktop. Google has written about why mobile and desktop rankings can differ, and the difference is diagnosed per query, not from a global stat.
- Check mobile experience separately. Even a desktop-heavy site has mobile visitors who convert or bounce. Mobile Core Web Vitals and usability are measured on their own; see reading Core Web Vitals failures in Search Console.
- Do not chase the global average. If your mobile share is small, the goal is a competent mobile experience, not reallocating your whole content plan away from desktop.
Method notes
- Pull device data from the same property, search type and window you use elsewhere; mixing windows makes trends meaningless.
- Impressions and clicks weight devices differently. Decide which question you are asking: "where are we seen" (impressions) or "where do people act" (clicks). Report both.
- Small samples hide behind percentages. If a device has a few dozen impressions, treat its CTR as noise.
- Record the date of any external statistic you cite, because these shares move year to year.
Device segmentation is a routine part of an ongoing SEO programme; where it fits is described in the Google SEO service. For the Chinese-language companion on the same topic, see 谷歌移动端与桌面端搜索流量对比.
Sources
- Desktop vs Mobile Market Share Worldwide — StatCounter Global Stats (September 2026: mobile 60.04%, desktop 39.96%).
- Performance report: Dimensions and data groupings — Search Console Help (device dimension).
- Site device figures: this site's Search Console, aggregated 2026-09-04 to 2026-10-01.
Edit note: all 2025 percentages from the prior version were removed because they lacked a verifiable source. Only the dated StatCounter figure and this site's own aggregated data are presented as numbers.